Microsoft (MS) Power BI is a combination of data analytics services, applications, and connectors. Together, those features provide users a platform to unify and visualize their data simply and effectively, helping users to gain a deeper data insight.
Power BI is a self-service platform where users create reports and dashboards for their enterprise business intelligence. Let’s explore some tips that can help your Power BI solutions to run faster and more efficiently (Myers, 2021).
Apply the most restrictive filters
Fewer data will help the loading speed of the visual. When applying filters, ask yourselves: Do the audiences need to see all of the data? Are there any ways to narrow down the number of data shown with minimal impact on audiences’ experience?
Control the number of visuals on report pages
You should limit the number of visuals on a report page to a necessary amount.
Ensure custom visual high performance
Keep in mind that visuals can affect the entire report. You should evaluate custom visuals probably.
Understand performance implications of dashboards
If you retrieve the data from a cache, the dashboard will perform better and more consistently than relying on the data source.
Optimize the environment power bi warehouse dashboard
You can optimize the Power BI environment by configuring capacity settings, sizing data gateways, and reducing network latency
Trueson is here to help
Specializing in Business Intelligence (BI), CRM, and Data Management, Trueson provides Reports & Dashboards services from A to Z, from collecting your data to visualize your business performance on Power BI reports and dashboards, including:
- Set up your business MS Power BI account
- Integrating data on Salesforce and other platforms to your Business Data Warehouse
- Setting up Data Pipeline & ETL (Extract, Transform, Load) process
- Analyzing data based on your business needs
- Optimizing performance of the Central Data Warehouse
- Visualizing your data on Salesforce Reports & Dashboards, Power BI, Data Analysis toolset
- Creating reports and dashboards
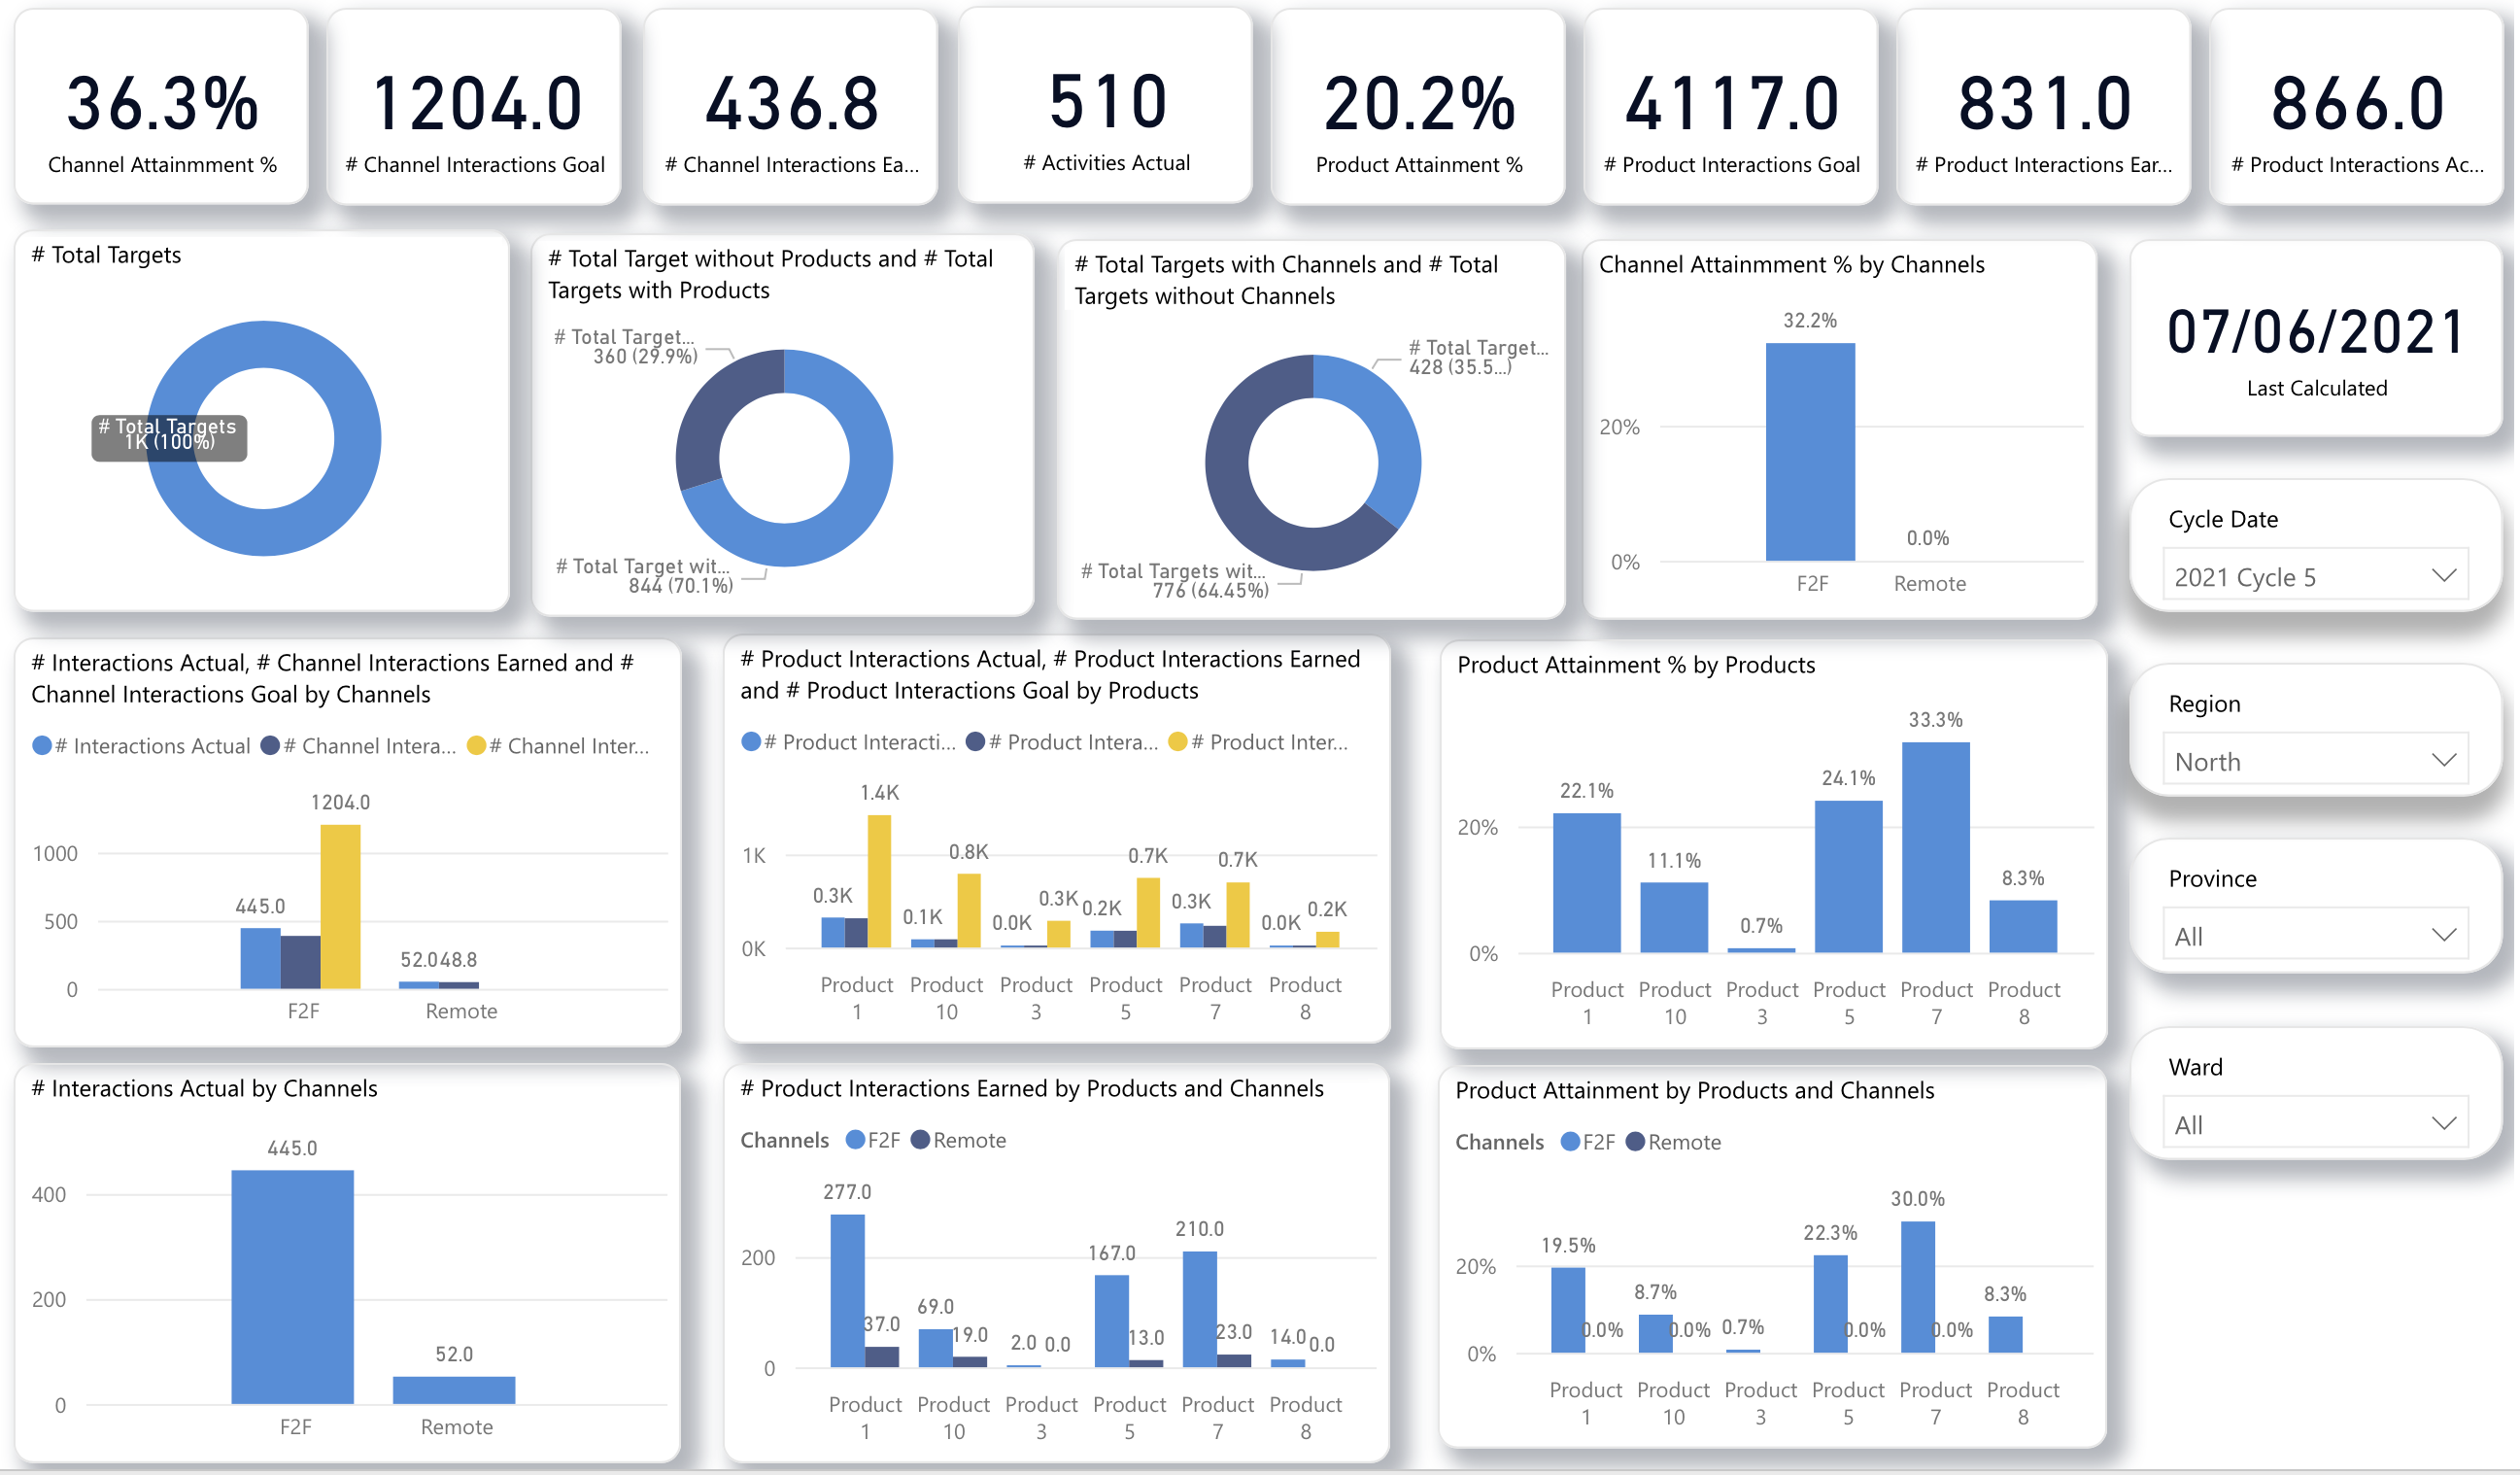
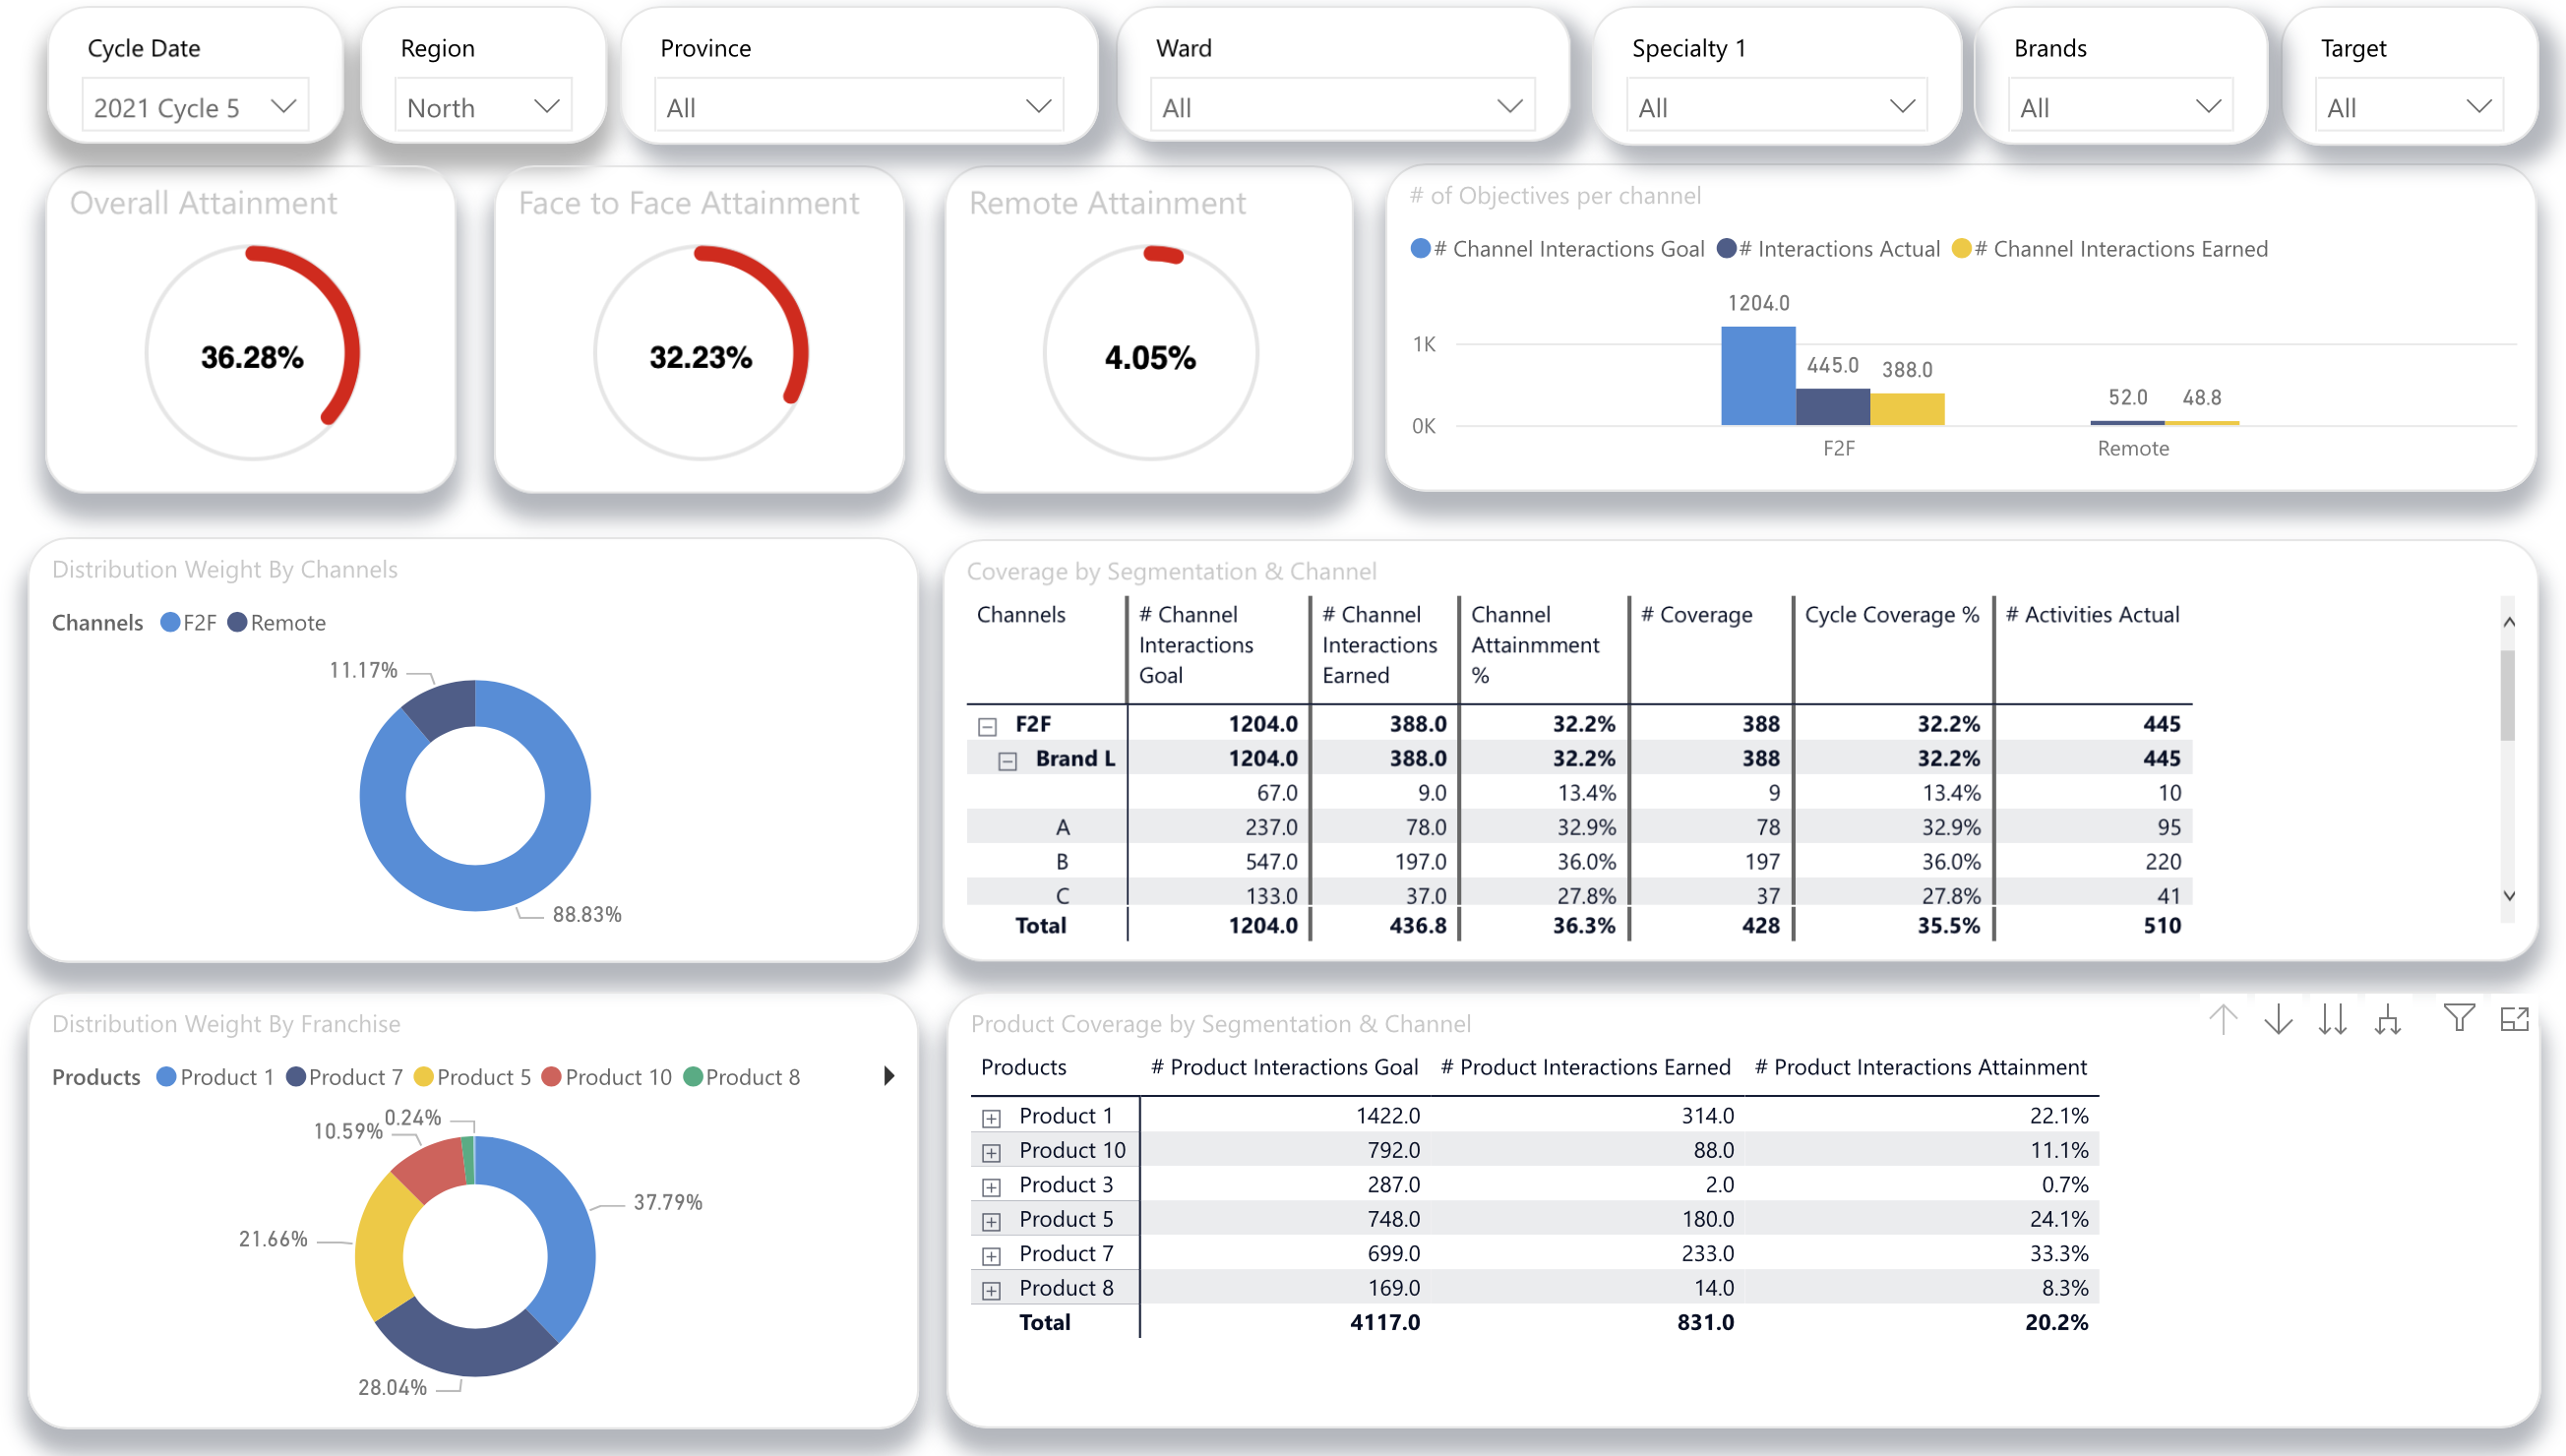
Examples of Trueson’s Power BI reports and dashboards:


Contact Trueson today for INITIAL CONSULTANCY: www.trueson.com
Reference:
Myers, P. (2021, February 4). Optimization guide for Power BI – Power BI. Retrieved August 18, 2021, from https://docs.microsoft.com/en-us/power-bi/guidance/power-bi-optimization


