
What are Reports and Dashboards in Salesforce?
Reports and Dashboards in Salesforce is an effective reporting tool to analyze and evaluate data.
Salesforce Reports and Dashboards are very important. They help users make data-driven decisions, save time, improve collaboration, customize their data analysis, and measure their results. By using Reports and Dashboards in Salesforce effectively, businesses can gain valuable insights into their operations and improve their overall performance.
How to improve your data analysis using Salesforce Reports and Dashboards?
Here are some tips that we found on Salesforce resources and our own use cases:
- Define clear goals and metrics
Before creating a report or dashboard, it’s important to define the specific goals you want to achieve and the metrics you want to track. This will help ensure that your reports and dashboards are focused and relevant to your business needs. - Keep it simple and organized
When creating reports and dashboards, it’s important to keep them simple and organized so that users can easily understand and use them. Use clear and concise labels, group related data together, and avoid clutter. - Use filters and custom fields
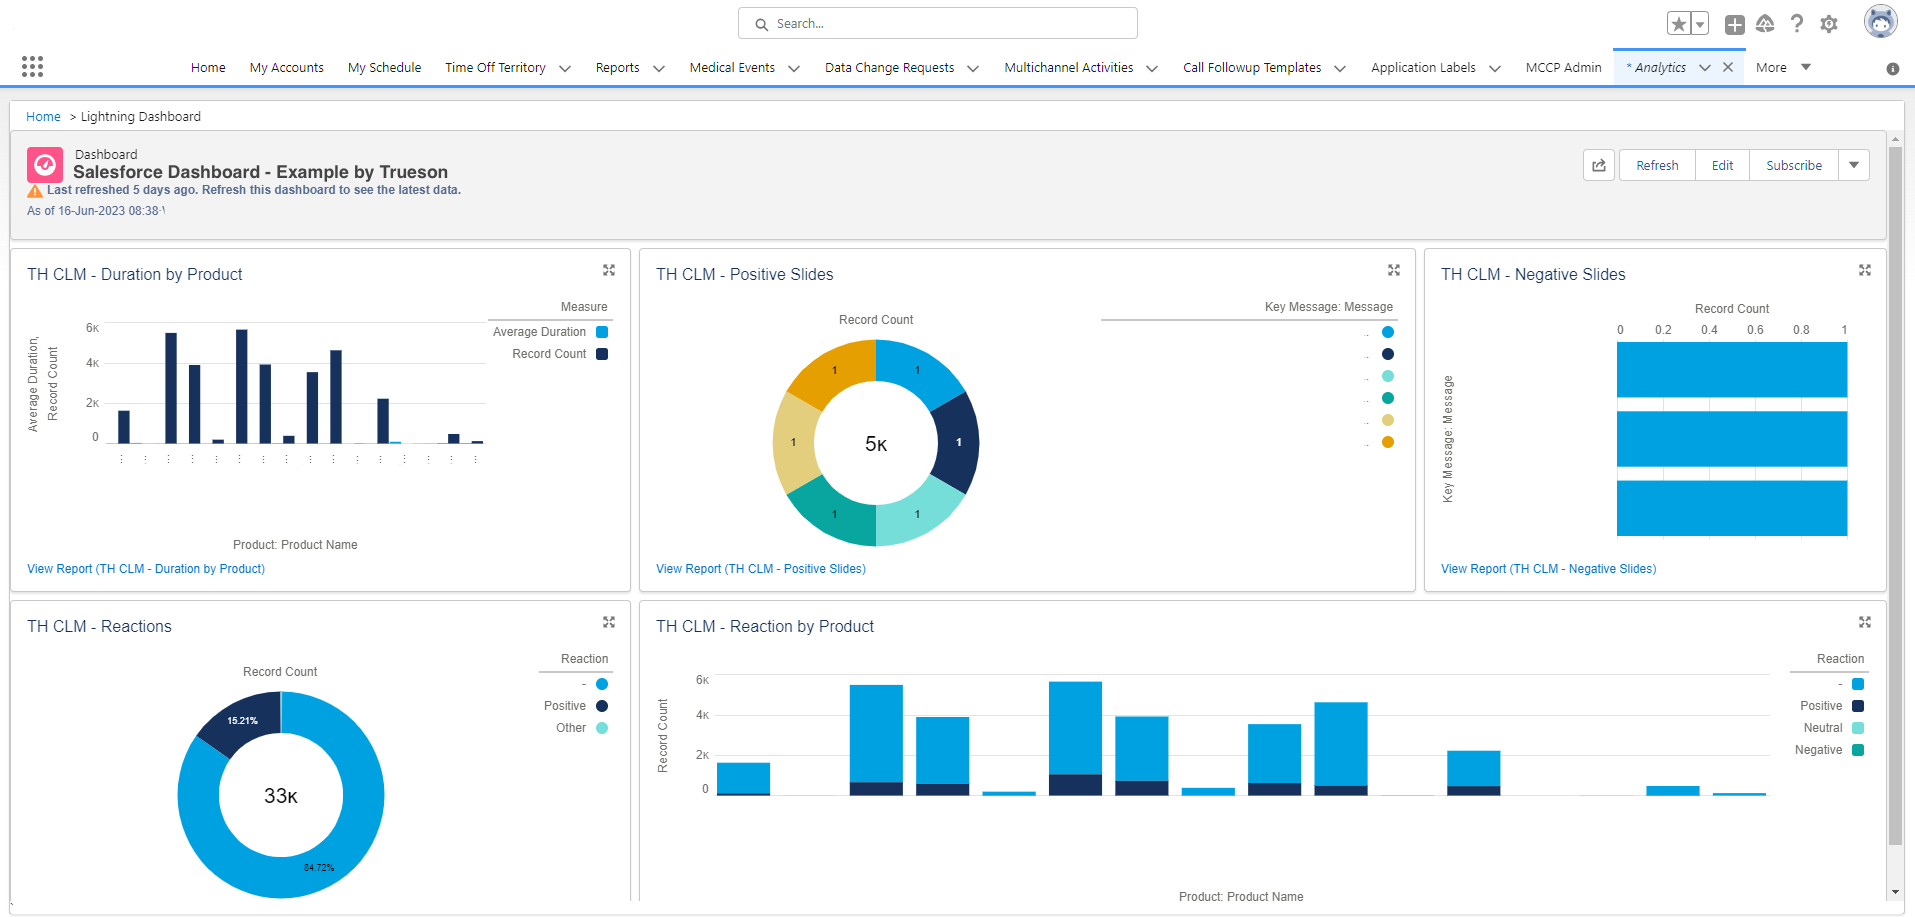
Filters and custom fields are powerful tools that can help you refine your data and make it more useful. Use them to narrow down data to specific categories or time periods, or to create new calculated fields that show specific insights. - Use charts and graphs
Charts and graphs are effective visual aids that can help users quickly understand complex data. Use them to illustrate trends, comparisons, and other key insights. - Share reports and dashboards with the right users
It’s important to share reports and dashboards with the right users so that they can use them effectively. Use Salesforce’s sharing settings to control who has access to reports and dashboards, and consider creating different versions for different users or teams.
To sum up, Salesforce Reports and Dashboards are powerful tools for improving data analysis and driving business success. By following best practices like defining clear goals, keeping reports simple and organized, using filters and custom fields, using charts and graphs, and sharing reports with the right users, businesses can gain valuable insights into their operations and make data-driven decisions.
Trueson’s BI Solutions and Salesforce Consultancy
Need help with Salesforce Reports and Dashboards?
Our team of Salesforce business analysts is here to assist you. We have years of experience helping businesses improve their data analysis and achieve their goals through the power of Salesforce. Let’s see how we can help you harness the full potential of Salesforce Reports and Dashboards.
CONTACT US TODAY to schedule a consultation!
Reference: Trailhead by Salesforce
