

Data-driven decision-making is becoming more and more popular in today’s business world. To turn raw data into readable insights for decision-making, data analysis, and visualization tools are needed, now more than ever. Today, we will compare the pros and cons of two of the most popular data analysis and visualization tools: Tableau and Power BI.
Tableau and Power BI are both tools for the collection, integration, analysis, and presentation of business information.
Similarities Tableau and Power BI
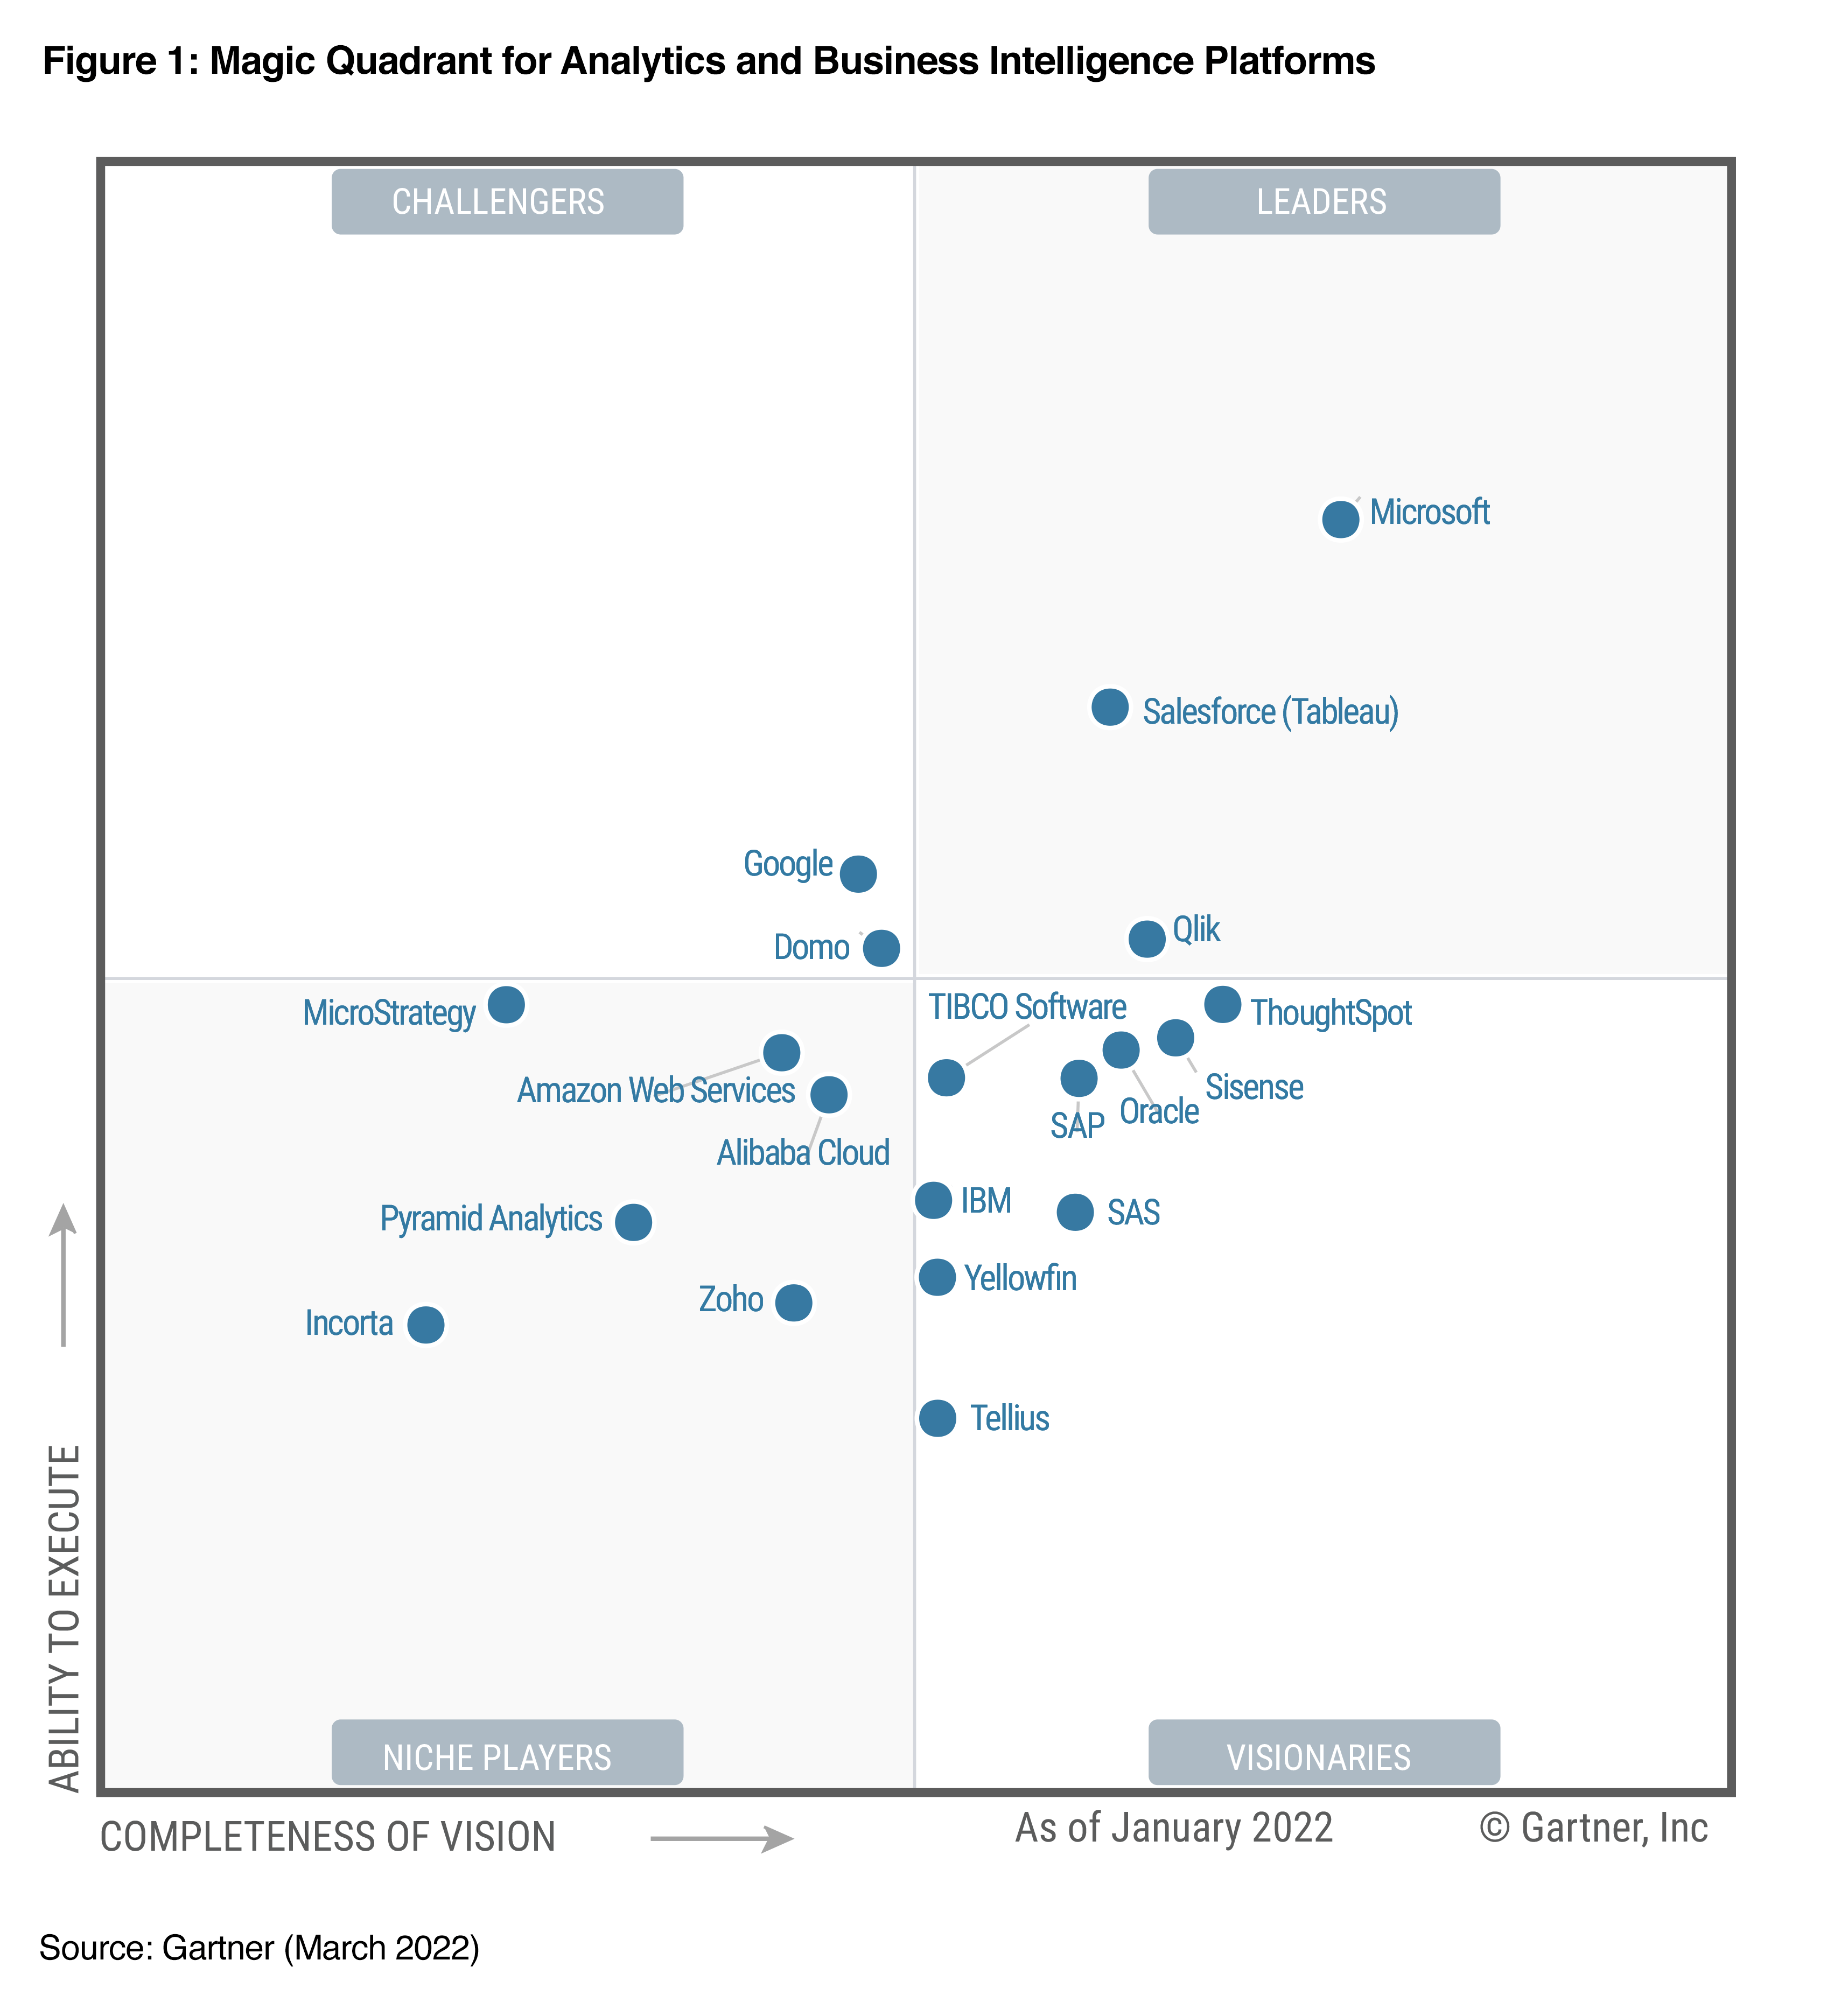
Are Tableau and Power BI similar? Power BI and Tableau are interactive data visualization software products with a primary focus on business intelligence. They are both market leaders in the data visualization field, as recognized by Gartner.
Power BI/Tableau Data connections
In both Power BI and Tableau, we have the option to connect to a variety of data sources, including csv, excel, Json files, or databases such as MySQL, and other online services like Salesforce.
Compare Tableau and Power BI in Data Processing
Both tools provide the ability to process data before using it for visualization. For Power BI, we can use Power Query, which is already included in the Power BI desktop. For Tableau, we need to download Tableau Prep Builder, which is a separate product dedicated to data preparation, in addition to the Tableau Desktop app for visualization.
Tableau vs Power BI visualization
Both tools provide a wide range of different visualizations, including bar charts, line charts, area charts, pie charts, treemaps, geographical maps, scatter plots, etc. To create visualizations, both tools apply the user-friendly drag-and-drop method.
Tableau vs Power BI performance in Visual Interaction
For both tools, we can click on the visualizations to get a more detailed view of the data, either by applying filters or getting additional bits of information from tooltips.
Differences
- Power BI Desktop is only available on Windows, not Mac.
If your organization is mostly using Mac computers, Tableau may be a better option.
Power BI vs Tableau Integration
Power BI was developed by Microsoft, so it has good integration with other Microsoft products. Since Tableau was acquired by Salesforce in 2019, it has been integrated into the Salesforce ecosystem. However, Power BI can still connect to Salesforce and Tableau can still connect to Microsoft Excel.
Tableau vs Power BI pricing
The price for both products varies based on the license. If you are considering using these tools to create dashboards, you can reference below rough comparison.
|
Name of License |
Cost (monthly) |
Name of License |
Cost (monthly, billed annually) |
|
Power BI Desktop |
Free |
Tableau Public |
Free |
|
Power BI Pro |
$13.70 /user |
Tableau Explorer |
$42 /user |
|
Power BI Premium |
$27.50 /user |
Tableau Creator |
$70 /user |
In general, Power BI is relatively more affordable than Tableau.
Power BI Desktop is free, with most of the functionalities for creating dashboards already available. Tableau Public is also a free version of Tableau, but its functionalities are limited.
If you need to share the dashboards, then you will also need to look at viewer licenses. Power BI Premium licenses start at $6,858.10/ month for the whole organization. Tableau Viewer’s price is $15 per user/month.
It depends on your needs.
Both tools are Market leaders. According to, the TrustRadius platform, Microsoft Power BI acquires 36% total market share, and Tableau Desktop shares 20% in 2021
Power BI is easy to learn
Conclusion Tableau vs Power BI differences
These two tools have more similarities than differences. They are both powerful visualization tools. However, each company may have specific needs that make one tool more suitable than the other.
So, which tool works best for your business? Contact our consultants today for advice!
Sources


